Empowering community managers with traffic insights to drive growth
Tool
Figma
Role
Product Designer
Timeline
3 weeks
Context we started with
Nas.io lets creators and community managers run, monetize, and grow online groups across WhatsApp, Telegram, email, and more. The platform already had core features, like setup, product creation, sales tracking, and payouts…but something was missing.
What was missing?
Homepage insights up to this point only housed total community members and monthly earnings. But if you're managing a community, you need visibility into the entire funnel. That includes traffic, daily visitors, member growth, engagement levels, and retention patterns so you can actually nurture your audience.
How might we give community managers the traffic insights they need, without overloading them?
We boiled down to three goals:
Surface early-funnel engagement (discoverability, visits)
Add meaningful analytics without complicating the UI
Build something scalable to support future growth
What’s new?
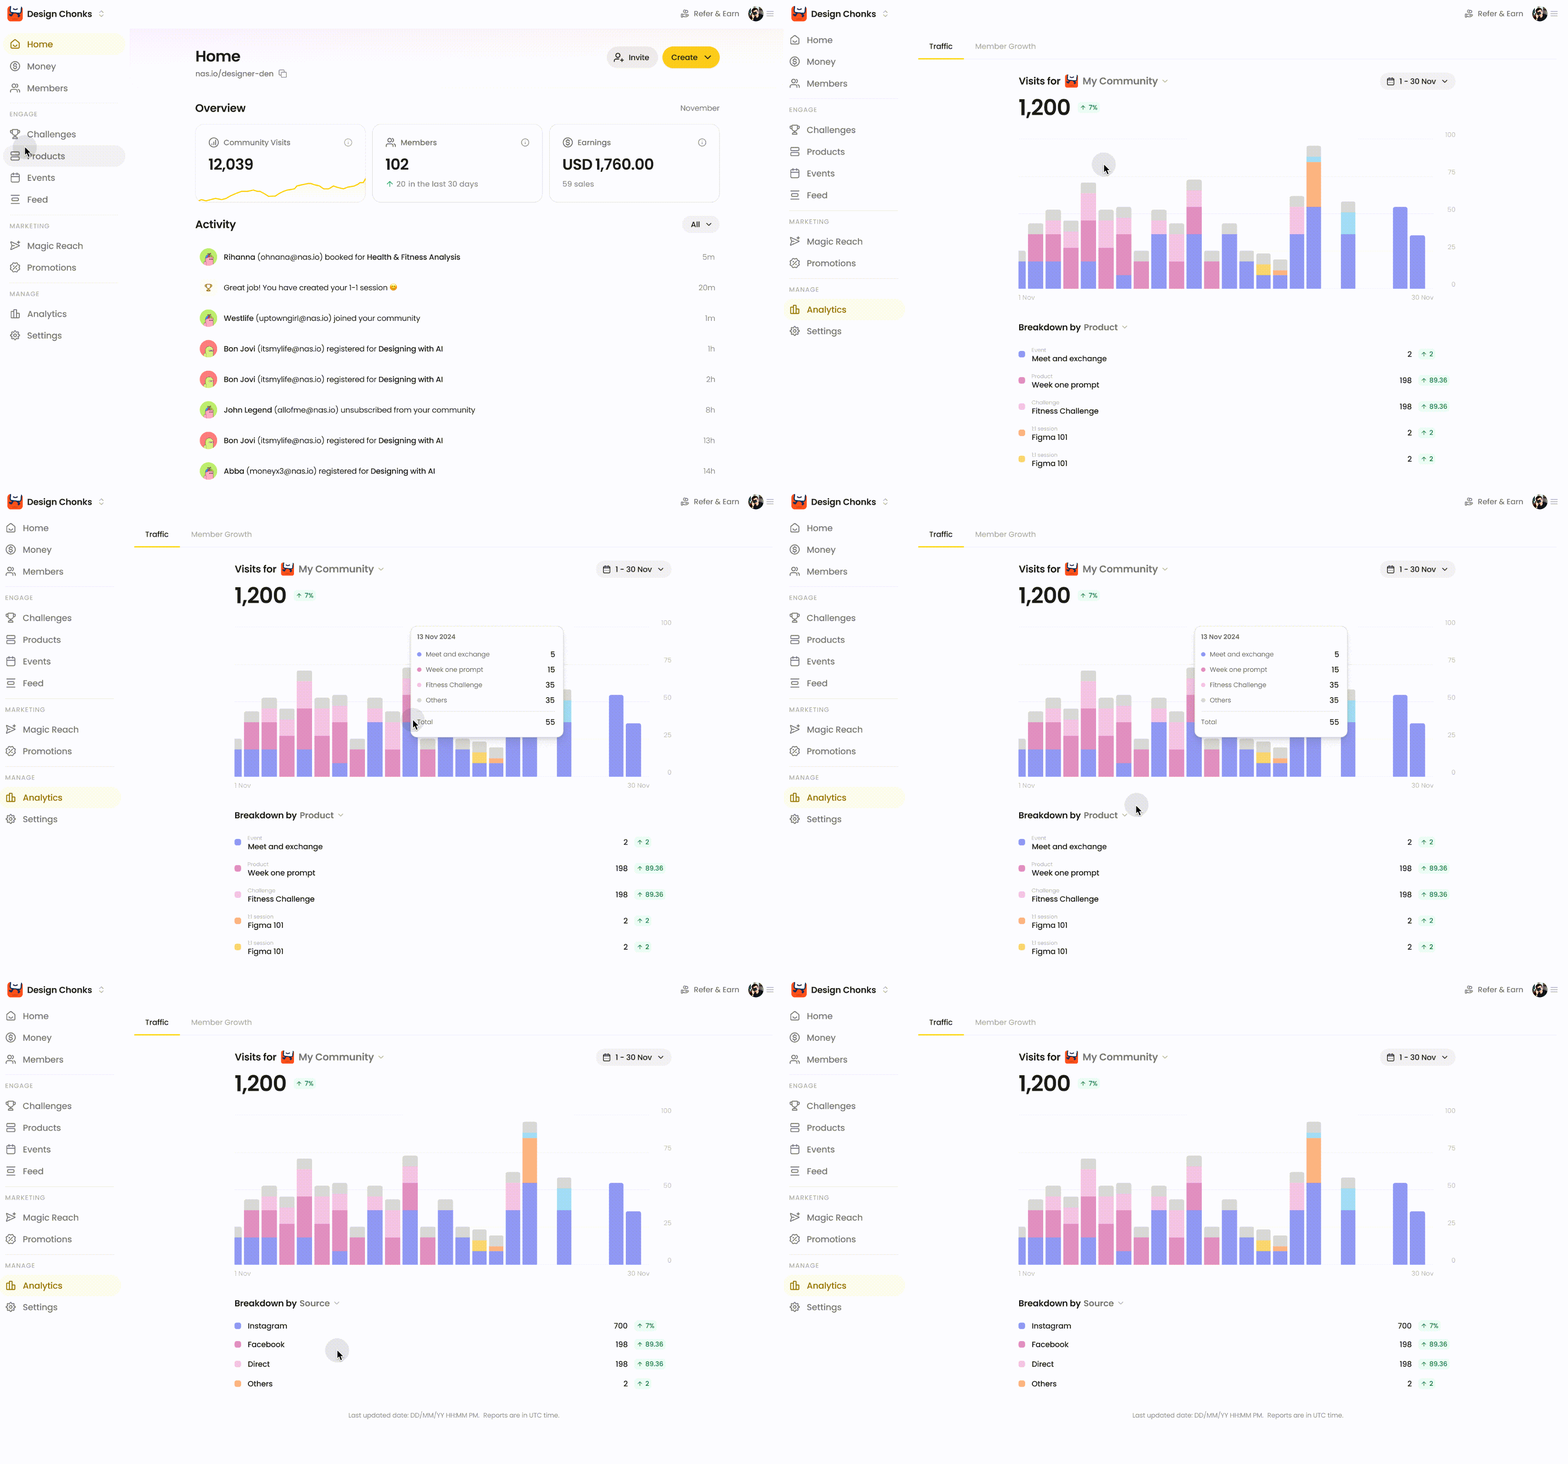
1. The dashboard homepage was enhanced by adding a Community Visits card alongside Members and Earnings, aligning all primary metrics within a consistent time frame. This update includes a daily trending line for the past 30 days, offering community managers quick, contextual insights into traffic patterns and fluctuations.
2. To support deeper exploration, clicking on the Monthly Visits metric directs CMs to a detailed analytics view.
3. CMs by default views the traffic for the entire community, and can further look into a specific product for more granular insights:
Ensuring standardization and customization across analytics was a priority. Consistent date ranges were applied across all metrics to maintain clarity.
Two options were evaluated for date filtering: a fixed monthly count for simplicity and a filterable date range to provide users with greater flexibility in analyzing their data.
CMs can further breakdown metrics by product type or source:
Impact & Takeaways
The introduction of traffic data empowers community managers by surfacing key engagement metrics directly on the homepage. This improves their ability to monitor community health at a glance and supports faster, more informed decision-making.
The modular design of the dashboard ensures long-term scalability, setting a foundation for future analytics like retention, member growth, and product performance while keeping the experience lightweight and intuitive for first-time users.
Next Story
Petition platform for social impact
Researched and delivered a reimagined dashboard and digital assets on Change.org to bridge petition stake-holders to their objectives.
Read →


